A Redesign Case Study

A Simplified and Empowering Chart Title Editor

A Simplified and Empowering Chart Title Editor

End-to-end Redesign

8 weeks

Web

Product Designer

End-to-end Redesign

8 weeks

Web

Product Designer

SUMMARY

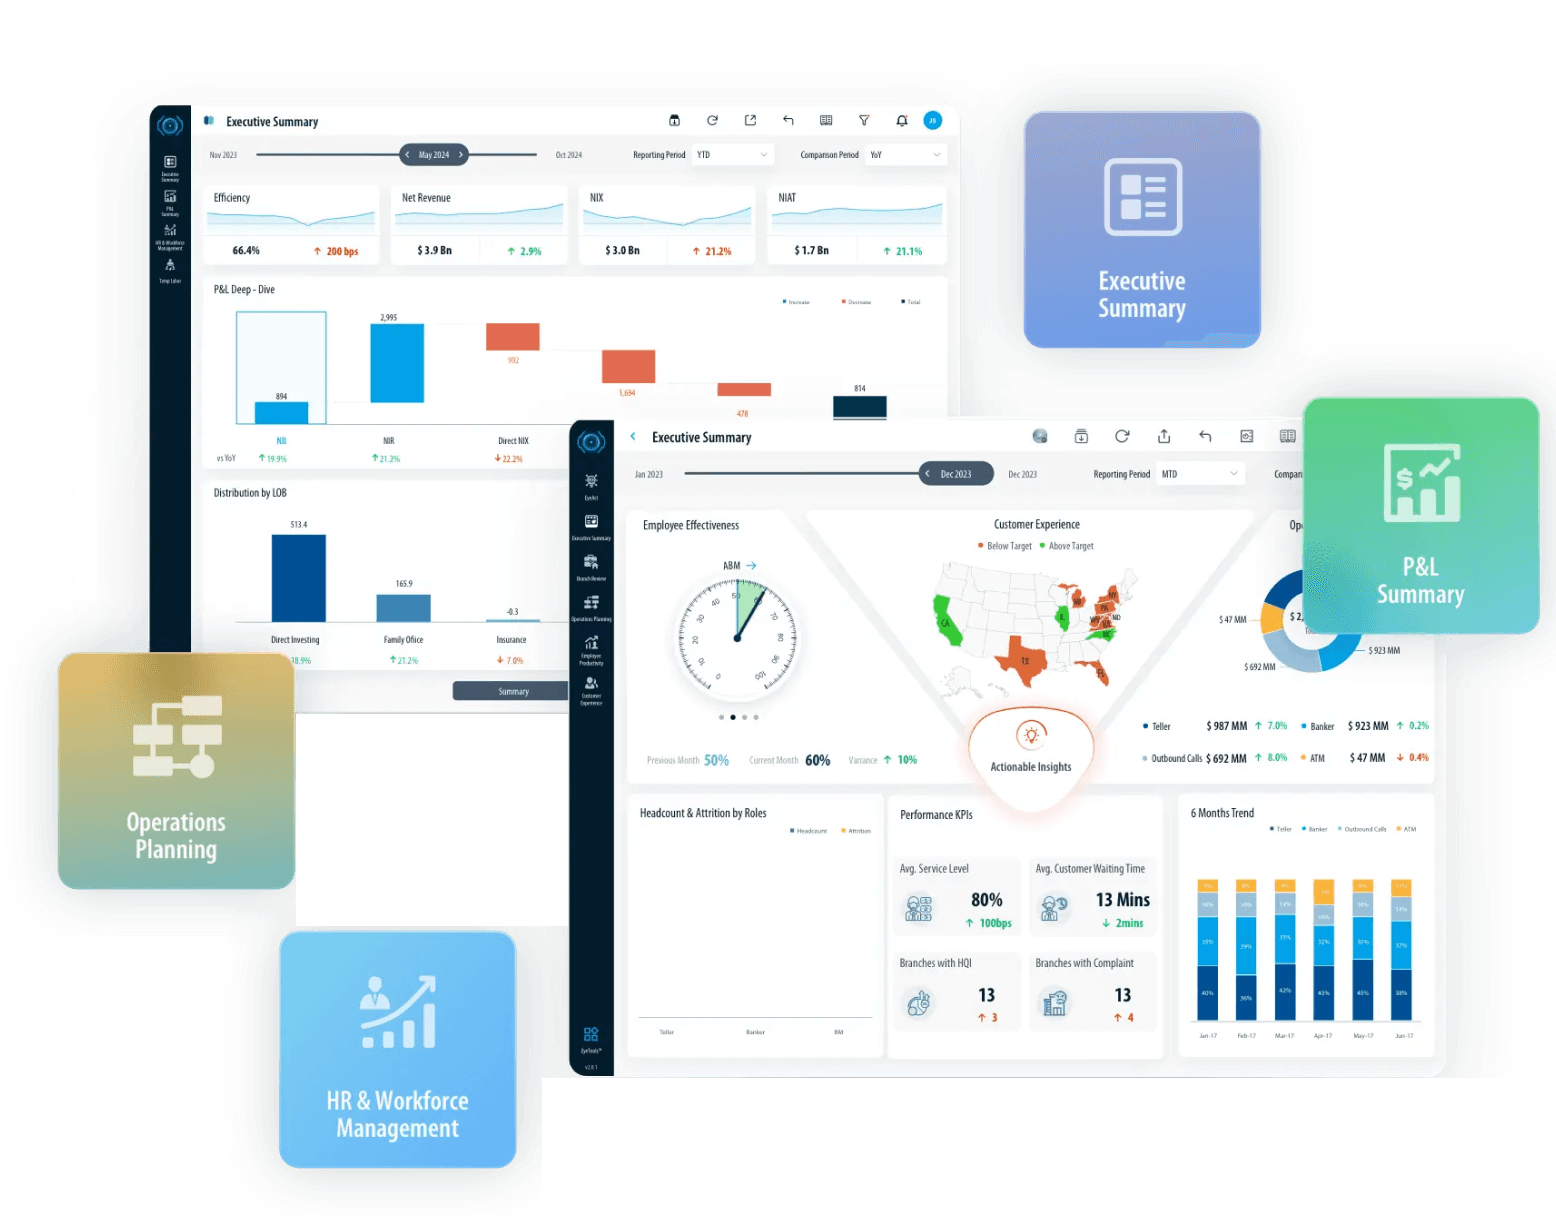
Essex Lake Group provides advisory services to major banks through their SaaS product. A key strength is their ability to offer tailored data platforms to clients. I contributed to the data platform backend, which is designed for the data analyst team to build visualized dashboards for client consumption.

THE BUSINESS GOAL

Enhance the flexibility of tailoring data platforms to better meet specific client customization needs.

/ MY ROLE

1.Collaborated with business analysts to define functionalities and identify opportunities for improvement.

2.Conducted competitor analysis and user interviews to gather and analyze insights.

3.Hold discussion with stakeholders to explore multi design approaches.

4.Delivered final flow including usage scenarios, edge cases, prototype, and design specifications, and provided guidance during development.

/ QUALIFICATION HIGHLIGHT

1.Data visualization skills applied throughout the design process.

2.Utilized UX strategy for business to align design decisions with project goals.

3.Demonstrated proactive ownership in driving improvements and delivering solutions.

Impact

The data analyst team transitioned to the redesigned platform, resulting in an 80% drop in bug reports and significantly improved loading performance for clients.

The data analyst team transitioned to the redesigned platform, resulting in an 80% drop in bug reports and significantly improved loading performance for clients.

The defined design and interaction framework are also used as a template for other tasks.

The defined design and interaction framework are also used as a template for other tasks.

Why titles matter?

Why titles matter?

Title gives generic context for viewers, and it matters even more as a chart title. Charts can interact with elements such as dashboard filters, charts, even across the dashboard. Chart titles help viewer to understand the context, and reflect on the changes.

Title gives generic context for viewers, and it matters even more as a chart title. Charts can interact with elements such as dashboard filters, charts, even across the dashboard. Chart titles help viewer to understand the context, and reflect on the changes.

Clarify the subject

Clarify the subject

Title provides a concise summary of the data, making it easier for viewers to grasp the key message without digging.

Title provides a concise summary of the data, making it easier for viewers to grasp the key message without digging.

Comprehensible Navigation

Comprehensible Navigation

Title helps users stay on track across dashboards, making complex layouts easier to navigate.

Title helps users stay on track across dashboards, making complex layouts easier to navigate.

Clarity and Interpretation

Clarity and Interpretation

Title updates based on user interaction - like filters, selections, helps reflect exactly what the chart is showing in real time.

Title updates based on user interaction - like filters, selections, helps reflect exactly what the chart is showing in real time.

Audit current flow

Audit current flow

To understand the current flow, I began by creating chart titles myself and reviewing polished dashboards from the data analyst team. This helps me grasp the end-to-end process and real world scenarios. I discovered that over 70% of the chart title includes at least 1 dynamic field to make the title dynamic.

To understand the current flow, I began by creating chart titles myself and reviewing polished dashboards from the data analyst team. This helps me grasp the end-to-end process and real world scenarios. I discovered that over 70% of the chart title includes at least 1 dynamic field to make the title dynamic.

Creating with title editor

The magic is all created at the back-end edit platform by the data analyst team.
They will pre-set the relationship between charts, and create the title with the chart editor: adding text and dynamic fields.

The magic is all created at the back-end edit platform by the data analyst team.
They will pre-set the relationship between charts, and create the title with the chart editor: adding text and dynamic fields.

Editing Behavior

By default, the editor is set to “Static” mode, allowing unlimited plain text input.Switching to “Dynamic” enables users to insert valid data fields, this allows titles to reflect chart-level interactions like filters and selections.

By default, the editor is set to “Static” mode, allowing unlimited plain text input.Switching to “Dynamic” enables users to insert valid data fields, this allows titles to reflect chart-level interactions like filters and selections.

Preview & Publish Flow

The preview experience is limited - users only see the final title as it appears to clients after publishing. Some repetitive info is shown during setup, but there’s no real time preview, which can lead to errors or confusion.

The preview experience is limited - users only see the final title as it appears to clients after publishing. Some repetitive info is shown during setup, but there’s no real time preview, which can lead to errors or confusion.

/

How can we simplify the process yet make it more powerful?

Problem

Problem

The current process causes issues across multiple phases—limited functionality, low interactivity, and poor layout responsiveness—leading to slow load times, overlapping chart titles, and an inconsistent experience across devices for clients.

The current process causes issues across multiple phases—limited functionality, low interactivity, and poor layout responsiveness—leading to slow load times, overlapping chart titles, and an inconsistent experience across devices for clients.

Phase

Issues

Role

Data analyst

(Primary user)

Clients - Bank executives

(Secondary user))

While building the chart

The limited functionality and the current design couldn’t cover users needs, not interactive enough, not support necessary functions.

Putting as a dashboard

Workaround solutions required more elements to layer up. which significantly increase the loading time performance

Clients interact with the chart

Combining together, these are hurting our business: clients are giving negative feedback due to how the dashboard experience

Key insights

Key insights

I developed research questions around key aspects of title creation - job roles, workflows, dynamic needs, client expectations, pain points, and ideal views.


Through four analyst surveys, I uncovered user preferences and common challenges.

I also conduct a competitor analysis to identify functional gaps and explore potential feature integrations.

01. Supporting more value input categories

01. Supporting more value input categories

Title provides a concise summary of the data, making it easier for viewers to grasp the key message.

Title provides a concise summary of the data, making it easier for viewers to grasp the key message.

“Right now the system only supports input data fields through a dashboard filter, but we do have many cases that we need to use data fields through other formats or charts.”

“Right now the system only supports input data fields through a dashboard filter, but we do have many cases that we need to use data fields through other formats or charts.”

-Research participant

-Research participant

02.A need for customized default value input

02.A need for customized default value input

As one of the “nice to have” from the task requirement, a few participants also mentioned that they wanted to be able to edit the default value display in order to make better performance for title.

As one of the “nice to have” from the task requirement, a few participants also mentioned that they wanted to be able to edit the default value display in order to make better performance for title.

“We work with multiple datasets, and being able to edit the default value would really help - but we can’t do that right now, so we have to create derived fields instead.”

“We work with multiple datasets, and being able to edit the default value would really help - but we can’t do that right now, so we have to create derived fields instead.”

-Research participant

-Research participant

03.Providing role-based view for clarity

03.Providing role-based view for clarity

As the result from research and interviews, providing the preview based on the chart tile stage or users will help to bring clarity.

As the result from research and interviews, providing the preview based on the chart tile stage or users will help to bring clarity.

“We often see what clients see until we published the dashboard - which caused confusion.”

“We often see what clients see until we published the dashboard - which caused confusion.”

-Research participant

-Research participant

/

The combination of understanding the current process, research insights and the competitor analysis helped ime define the primary problem and challenge at hand.

The combination of understanding the current process, research insights and the competitor analysis helped ime define the primary problem and challenge at hand.

UX strategy

Mapping UX back to business.

Mapping UX back to business.

/

UX goals

Goals

Solutions

01

Simplify task flow through Information Architecture

Simplify task flow through Information Architecture

Prioritize task and focus on one at each time period. display relevant functions at once and not overwhelming users

Prioritize task and focus on one at each time period. display relevant functions at once and not overwhelming users

02

Enhance flexibility for customization

Enhance flexibility for customization

Design around real-world scenarios by supporting multiple dynamic fields, customizable default values, and adaptive display logic that fits diverse use cases.

Design around real-world scenarios by supporting multiple dynamic fields, customizable default values, and adaptive display logic that fits diverse use cases.

03

Build an Editor that feels like a cohesive experience

Build an Editor that feels like a cohesive experience

> Merge static and dynamic title creation into a single, seamless flow - treating the editor as one cohesive task.


> Tailor the preview experience for different user roles: highlight detailed control for data analysts, and clarity of output for client users.

> Merge static and dynamic title creation into a single, seamless flow - treating the editor as one cohesive task.


> Tailor the preview experience for different user roles: highlight detailed control for data analysts, and clarity of output for client users.

Final design

Final design

01.Bring title experience as a whole

01.Bring title experience as a whole

Users can add a title for the first time or edit an existing one. The button label updates dynamically based on the state.

The editor includes familiar font settings and live preview. Users can insert valid dynamic fields with one click. A character limit helps guide clarity and brevity.

After saving, the popup closes automatically. If canceled, the previous title preview remains unchanged.

02.Bring title experience as a whole

02.Bring title experience as a whole

The editor includes:
a. Font settings
b. Insert function for dynamic fields
c. Character limit in the input box

To streamline the chart title experience, users can enter static text, dynamic fields, and subtitles—all within a single input box.

03.Exploring dynamic possibilities

03.Exploring dynamic possibilities

Inserted dynamic fields(if valid) will display with: a. curly braces b.yellow label. Invalid fields lose both and are shown as plain text.

"Default display" appears when at least one valid dynamic field is inserted—showing the field name, default input, and character limit.

Different cases include:

-Apply same dynamic fields for more than once

-Invalid field input

-Field status changing from valid to invalid

04.Considering the actual sceniaro

04.Considering the actual sceniaro

The editor also introduces a new way to add dynamic fields—auto-suggestions appear as users type, making it easier to find and insert valid options.

05.Preview with a focus

05.Preview with a focus

The preview panel updates responsively based on user input.

Alignment and adjustment tools let users fine-tune and preview changes in real time.

The preview panel at the right side reflects what clients will see on the front-end, enabling real-time review.

06.Manage the expected display

06.Manage the expected display

When titles become long due to filter or dropdown selections, a hover tooltip lets clients view the full title without taking up extra space.

Reflections

Simplifying Requires Deep Research

Simplifying Requires Deep Research

Data can be complicated, and analysts are trained to navigate that complexity. By understanding the product and data environment, I focused the design around simplifying the process without losing critical functionality.

Data can be complicated, and analysts are trained to navigate that complexity. By understanding the product and data environment, I focused the design around simplifying the process without losing critical functionality.

Turning Research into Actionable Design

Turning Research into Actionable Design

Multiple design approaches were explored, but testing made the difference. Through usability tests, A/B experiments, and user feedback, I validated what truly helped users—proving that data-backed design decisions drive the best outcomes.

Multiple design approaches were explored, but testing made the difference. Through usability tests, A/B experiments, and user feedback, I validated what truly helped users—proving that data-backed design decisions drive the best outcomes.

Aligning UX with Product Philosophy

Aligning UX with Product Philosophy

Redesigning isn’t just about improvements—it’s about fit. By learning from research, competitors, and internal goals, I ensured the design aligned with our mission: delivering customizable, user-driven data solutions while keeping the flow simple and intuitive.

Redesigning isn’t just about improvements—it’s about fit. By learning from research, competitors, and internal goals, I ensured the design aligned with our mission: delivering customizable, user-driven data solutions while keeping the flow simple and intuitive.

Future potential

Leveraging AI for Greater Customization

Leveraging AI for Greater Customization

Some ideas about how AI can further enhance client flexibility by:

1.Suggested Titles — Auto-generate title ideas based on chart content and user behavior.

2.Frequent Dynamic Fields — Recommend commonly used fields across similar charts to speed up creation.

3.Collaborative Editing — Support multi-user editing with AI-suggested improvements and consistency checks.

@2025 Zoe Yunnan Zhang All Rights Reserved.

@2025 Zoe Yunnan Zhang All Rights Reserved.

@2025 Zoe Yunnan Zhang All Rights Reserved.